
Markets move for reasons beyond chart patterns and indicators. Fundamental analysis basics help beginners understand why prices change by examining economic data, company performance, and policy decisions. This approach adds context to price movement and prevents trading in isolation from real-world drivers that influence long-term trends.
Beginners often feel overwhelmed by news and data releases. Fundamental analysis provides a structured way to filter information and focus on what truly matters. Understanding core drivers improves patience, expectation management, and alignment with broader market forces rather than reacting to every headline.
This guide explains fundamental analysis in a clear, beginner-friendly way and shows how to apply it practically:
What Fundamental Analysis Really Is
Fundamental analysis studies the underlying factors that influence an asset’s value. For stocks, this includes earnings, revenue growth, and financial stability. For indices, forex, and commodities, it focuses on economic growth, inflation, employment, and policy decisions that affect supply, demand, and investor confidence.
Rather than timing exact entries, fundamental analysis helps identify direction and bias. Beginners use it to understand whether conditions support strength or weakness over time. This perspective reduces random trading and improves strategic thinking across different market environments.
Why Traders Use Fundamental Analysis
Traders use fundamental analysis to understand context rather than predict exact price levels. It explains why trends form and why some moves persist longer than others. When fundamentals support price direction, technical signals often perform more reliably.
Fundamental analysis also helps beginners avoid trading against powerful forces. Strong economic growth or tightening policy can dominate short-term chart signals. Knowing the backdrop improves trade selection and reduces frustration caused by repeatedly fighting the market.
Note: Fundamentals explain direction, not precise timing.
Key Economic Indicators Beginners Should Know
Economic indicators provide measurable insight into economic health. Growth data shows expansion or contraction. Inflation data affects purchasing power and policy decisions. Employment data reflects consumer strength and business conditions.
Beginners do not need to track everything. Focus on widely followed indicators that consistently influence markets. Understanding their impact improves the interpretation of market reactions and reduces surprise during major releases.
Core indicators beginners should focus on include:
- Inflation data measuring price stability
- Employment reports showing labor strength
- Economic growth figures reflecting expansion
These indicators shape expectations and long-term trends across multiple markets.
Interest Rates and Central Bank Policy
Interest rates play a major role in financial markets. Higher rates increase borrowing costs and often pressure risk assets. Lower rates support growth by encouraging spending and investment. Central banks adjust rates to control inflation and economic stability.
Policy decisions from the Federal Reserve and other central banks influence currencies, indices, and bonds simultaneously. Beginners benefit from understanding whether policy tightens or loosens conditions before trading around major announcements.
Interest rate direction often matters more than the decision itself. Expectations drive price movement ahead of events.
Fundamental Analysis in Stock Trading
For stocks, fundamental analysis focuses on company performance. Earnings reports show profitability. Revenue growth shows demand. Debt levels show financial risk. Together, these metrics shape investor confidence.
Beginners should focus on simple metrics rather than deep financial modeling. Consistent earnings growth and stable balance sheets often support long-term price appreciation. Sudden earnings disappointments often lead to sharp declines regardless of chart patterns.
Fundamental Analysis in Indices
Indices represent groups of companies, so their fundamentals reflect overall economic health. Strong consumer demand and business investment often support index growth. Economic slowdowns or rising costs often pressure indices lower.
Indices respond strongly to macro data and policy changes. Beginners use fundamental analysis to identify whether conditions favor expansion or contraction across sectors. This view improves alignment with broader trends and reduces reliance on short-term noise.
Fundamental Drivers in Forex Markets
Forex markets reflect relative economic strength between countries. Traders compare growth, inflation, and interest rate expectations across economies. Currency values adjust as expectations shift.
Beginners benefit from focusing on interest rate differentials and economic momentum. When one economy strengthens faster than another, its currency often appreciates. This framework helps avoid random pair selection and improves directional bias.
Fundamental Analysis in Commodities
Commodities respond strongly to supply and demand factors. Economic growth increases demand for energy and metals. Weather and production issues affect agricultural supply. Policy and geopolitics influence availability and transport.
Beginners use fundamental analysis to understand whether markets tighten or loosen over time. Persistent shortages often support higher prices. Oversupply often pressures prices lower regardless of short-term technical signals.
This understanding helps avoid trading against physical market realities.
How Fundamentals and Technicals Work Together
Fundamental and technical analysis complement each other. Fundamentals define direction and context. Technicals help time entries and exits. Beginners often struggle when using one without the other.
For example, bullish fundamentals combined with technical pullbacks often offer higher-quality opportunities. Bearish fundamentals combined with technical rallies often present selling opportunities. Alignment improves probability and reduces emotional conflict. Using both approaches creates a balanced trading framework.
Tip: Use fundamentals for bias and technicals for execution.
Common Beginner Mistakes With Fundamental Analysis
Beginners often overreact to news headlines without understanding context. Single data points rarely change long-term trends. Another mistake involves tracking too many indicators, which creates confusion and paralysis.
Some beginners attempt to predict outcomes rather than assess scenarios. Fundamental analysis focuses on probabilities and expectations, not certainty. Understanding this distinction improves patience and decision-making. Avoid trading immediately after news without preparation or experience.
Building a Simple Fundamental Analysis Routine
A simple routine improves consistency. Identify which indicators matter for your market. Track their trend rather than individual releases. Note how markets react to surprises versus expectations.
Combine this information with the technical structure. Ask whether fundamentals support trend continuation or reversal. This approach keeps analysis grounded and avoids emotional reactions to every data point.
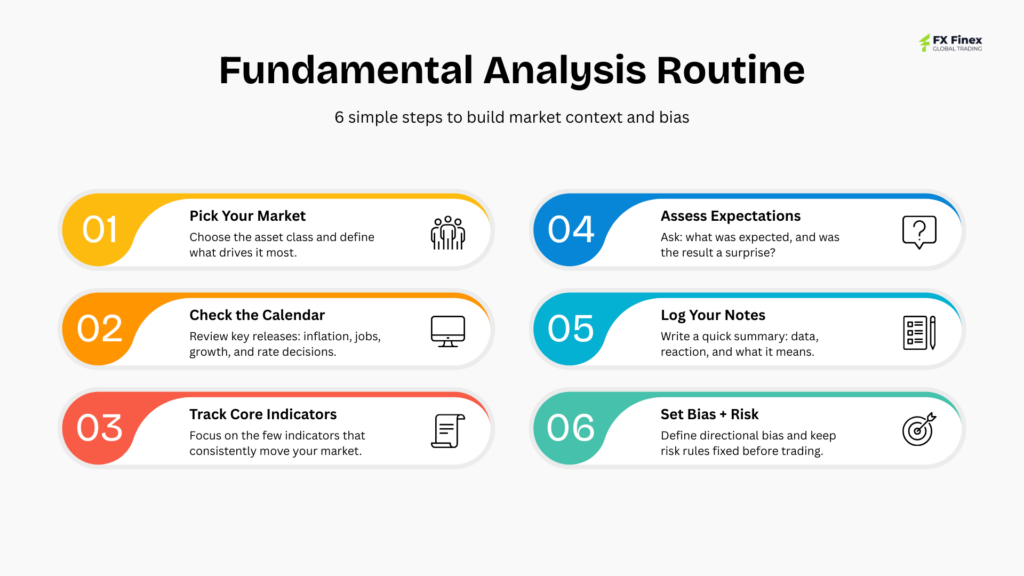
Simple beginner fundamental routines include:
- Monitoring key economic indicators
- Tracking policy direction and expectations
- Aligning trades with broader economic trends
Risk Management and Fundamentals
Strong fundamentals do not remove risk. Markets still react unpredictably. Beginners must control exposure regardless of conviction level. Oversized trades based on strong beliefs often lead to large losses.
Use predefined risk limits and stop losses even when fundamentals appear clear. Protecting capital allows learning and adaptation when conditions change unexpectedly.
Warning: Strong beliefs increase the risk of oversized positions.
Practicing Fundamental Analysis as a Beginner
Practice involves observation rather than constant trading. Follow economic calendars. Observe market reactions to data. Compare expectations with outcomes. Over time, patterns emerge.
Journaling observations improves understanding. Write what you expected and what occurred. This reflection builds intuition and confidence without rushing execution. Learning fundamentals takes time and patience.
Wrapping Up
Learning fundamental analysis basics helps beginners understand the forces that drive market trends across stocks, indices, forex, and commodities. Economic data, earnings, and policy decisions provide essential context for price movement. When combined with technical analysis and disciplined risk control, fundamental analysis supports clearer decisions and steadier progress throughout the trading journey.