
Many beginners feel overwhelmed when looking at price charts for the first time. Technical analysis basics help you understand price behavior by focusing on charts rather than news or opinions. This approach studies historical price movement to identify structure, trends, and potential decision areas, giving traders a repeatable framework instead of emotional reactions.
Technical analysis works across forex, stocks, indices, and commodities. Prices reflect collective decisions from millions of participants. By learning how prices move and react, beginners gain context that supports disciplined execution rather than impulsive entries based on fear or excitement.
This guide explains technical analysis clearly so beginners understand what to look for and why it matters:
What Technical Analysis Really Is
Technical analysis studies price movement using charts and historical data. It assumes that all known information is already reflected in the price. Instead of predicting events, traders analyze how the price behaves around certain levels and patterns to plan trades with defined risk.
This method focuses on probability, not certainty. Beginners benefit from understanding that no signal guarantees success. Technical analysis provides structure for decision-making by identifying areas where buyers and sellers previously reacted, which helps manage expectations and reduce emotional stress during live trading.
Why Traders Use Technical Analysis
Traders use technical analysis because price action remains visible and measurable. Charts show trends, ranges, and volatility clearly without relying on the interpretation of news or forecasts. This clarity allows traders to react to what the price does rather than guessing what it might do.
Technical analysis also supports consistency. When rules define entries and exits, results become easier to evaluate. Beginners improve faster because mistakes relate to execution rather than confusion about market direction or information overload.
Note: Technical analysis focuses on behavior, not prediction.
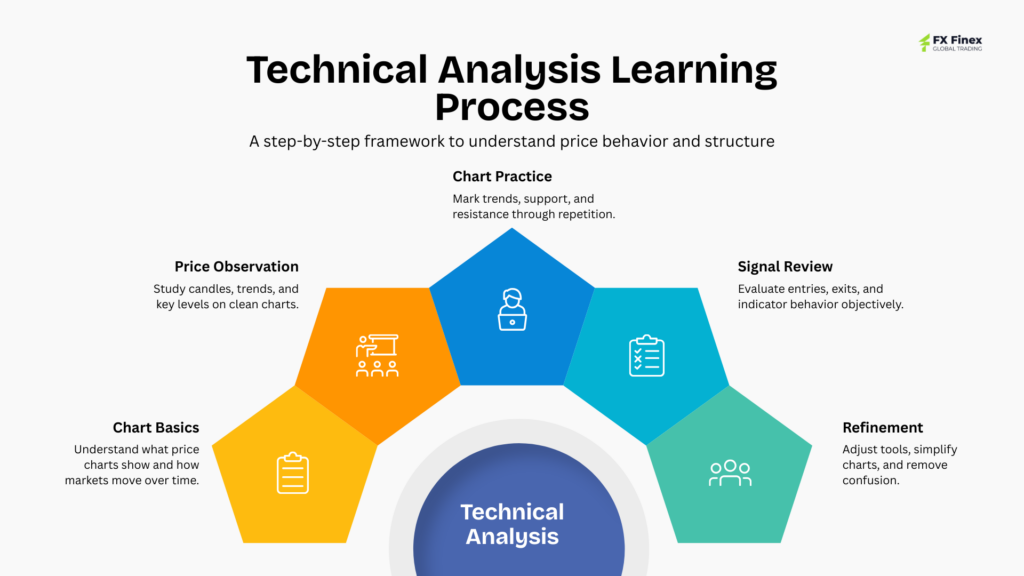
Understanding Price Charts
Price charts display how markets move over time. Each candle or bar shows open, high, low, and close prices for a selected period. This visual format reveals momentum, hesitation, and rejection areas that numbers alone cannot show.
Beginners should start with clean charts and avoid clutter. Candlestick charts work well because they clearly show buyer and seller strength. Observing how candles form near key areas helps traders understand market sentiment without complex tools.
Candlestick Basics for Beginners
Candlesticks show short-term sentiment shifts. Long bodies suggest strong momentum. Small bodies indicate indecision. Wicks show rejection where the price attempted to move but failed. These features help interpret immediate price behavior.
Beginners do not need to memorize many candle names. Focus on understanding what the candle represents. Is the price accepted or rejected? Is momentum strong or weakening? This interpretation matters more than pattern labels.
The most useful candlestick observations for beginners include:
- Large candles showing strong momentum
- Long wicks show rejection
- Small candles showing indecision
Reading candles improves timing and confidence.
Trends and Market Direction
A trend shows the general direction of prices over time. Uptrends form higher highs and higher lows. Downtrends form lower highs and lower lows. Sideways markets move within ranges without a clear direction.
Beginners benefit from trading with the trend rather than against it. Trend direction provides context for all decisions. Trading against the dominant direction increases difficulty and emotional pressure.
Understanding trend structure reduces random entries and improves trade alignment.
Support and Resistance in Technical Analysis
Support and resistance mark areas where the price previously reacted. These levels reflect collective memory. Buyers often appear near support. Sellers often appear near resistance. These zones help define where trades make sense.
Support and resistance form the backbone of technical analysis. Beginners use them to plan entries, exits, and stop placement. Levels work across timeframes and instruments, making them versatile tools.
Tip: Treat support and resistance as zones, not exact prices.
Indicators and Their Purpose
Indicators use mathematical calculations based on price and volume. They help highlight trends, momentum, or volatility. Indicators do not predict. They organize information already present in the price.
Beginners often overload charts with indicators. This creates confusion and conflicting signals. Using one or two simple indicators improves clarity and learning speed.
Common beginner indicators include:
- Moving averages for trend direction
- RSI for momentum and overbought conditions
- ATR for volatility awareness
Moving Averages Explained Simply
Moving averages smooth price data to show trend direction. When the price stays above a moving average, trend strength often remains positive. When the price stays below, downward pressure dominates.
Beginners use moving averages to avoid trading against the trend. They also act as dynamic support or resistance areas. Simplicity matters. One moving average often provides enough information early on. Moving averages work best when combined with price action.
Timeframes and Technical Analysis
Timeframes influence how signals appear. Higher timeframes show broader structure. Lower timeframes show detail and noise. Beginners benefit from starting with higher timeframes to reduce emotional stress.
Using multiple timeframes adds context. Identify a trend on a higher timeframe, then refine entries on a lower timeframe. This approach improves clarity and avoids trading against dominant structure.
Timeframe alignment improves decision quality through:
- Clearer trend identification
- Reduced false signals
- Better entry timing
Note: Consistency improves when timeframes align.
Volume and Market Activity
Volume measures how much activity occurs during price movement. High volume confirms interest. Low volume suggests weak participation. Volume adds depth to technical analysis by showing strength behind moves.
Beginners use volume to confirm breakouts or reversals. Rising price with falling volume often signals weakening momentum. Stable volume during consolidation suggests potential continuation.
Volume works best as a confirmation tool, not a trigger.
Common Beginner Mistakes in Technical Analysis
Many beginners seek certainty and overanalyze charts. They draw too many lines, add too many indicators, and change rules frequently. This behavior creates confusion and frustration. Another mistake involves ignoring risk management. Technical analysis does not remove losses. Levels fail. Signals fail. Risk control protects accounts when analysis fails.
Warning: Complexity reduces consistency for beginners.
Building a Simple Technical Analysis Routine
A simple routine improves discipline. Start by marking the trend direction. Identify key support and resistance zones. Observe price behavior near those areas. Decide risk before entry.
Repeating this process builds skill gradually. Improvement comes from consistent execution and review, not from constantly changing tools.
Simple technical routines often include:
- Trend identification
- Level marking
- Entry confirmation
- Risk definition
Practicing Technical Analysis Effectively
Practice involves observation and review. Study historical charts. Note how price reacts at levels. Replay charts if possible. Focus on understanding behavior rather than predicting outcomes.
Journaling observations improves learning. Write why a level mattered or why a signal failed. This reflection builds pattern recognition and confidence over time. Skill develops through repetition and patience.
Wrapping Up
Learning technical analysis basics gives beginners a structured way to understand price behavior across markets. Charts, trends, levels, and indicators provide context without relying on forecasts. When applied with discipline and risk control, technical analysis supports clearer decisions, calmer execution, and steady progress during the learning process.