
Price charts often look chaotic to new traders, yet structure exists beneath the movement. Support and resistance trading helps beginners identify areas where the price repeatedly reacts, pauses, or reverses. These levels reflect collective behavior rather than prediction, which makes them practical tools across markets, timeframes, and trading styles.
Beginners who understand these concepts stop chasing price and start waiting for price to reach meaningful areas. This shift improves timing, reduces emotional entries, and creates a logical framework for planning trades instead of reacting impulsively to every candle.
This guide explains support and resistance in simple terms and shows how beginners apply them correctly!
What Support and Resistance Really Mean
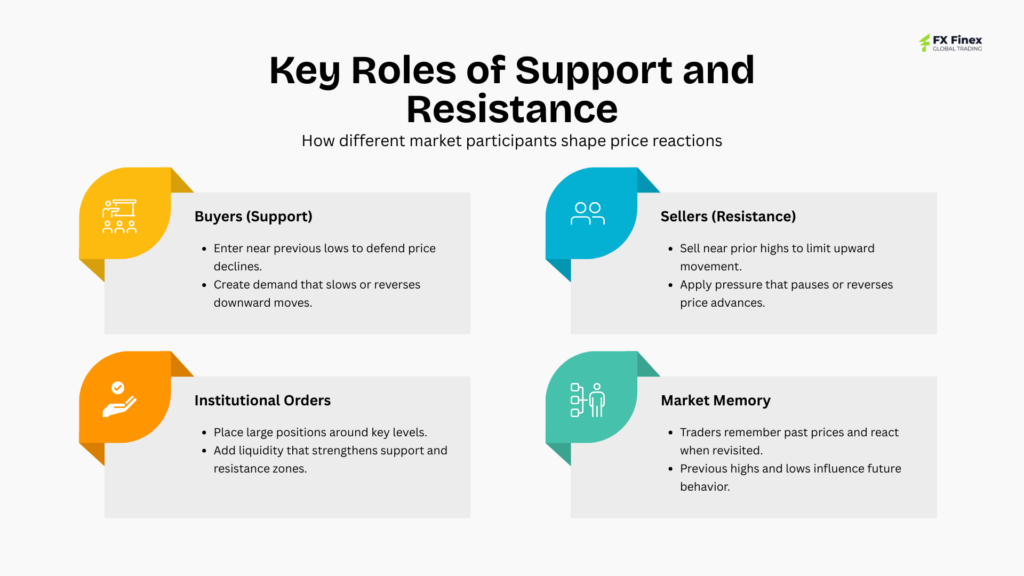
Support refers to a price area where buying pressure tends to slow or stop a decline. Resistance refers to a price area where selling pressure often limits further advances. These zones form because traders remember past prices and react when price returns to them, creating repeated behavioral patterns on charts.
Support and resistance are not exact lines. They are zones where reactions occur. Beginners often struggle because they expect precision. Learning to view these levels as areas rather than exact prices improves interpretation and reduces frustration during normal market noise.
Why Support and Resistance Levels Form
Support and resistance form due to human behavior. Traders place buy orders near prior lows and sell orders near prior highs. Institutions manage positions around visible levels where liquidity exists. These actions create repeated reactions at similar price areas.
Psychology plays a role. Traders who missed entries wait for the price to return. Traders holding losing positions exit when the price revisits break-even. These behaviors cluster orders around the same prices, reinforcing the importance of those levels over time.
Identifying Support and Resistance on Charts
Beginners identify support and resistance by looking for areas where the price reversed multiple times. Swing highs often mark resistance. Swing lows often mark support. The more times the price reacts at an area, the more relevant the level becomes.
Use clean charts without excessive indicators. Horizontal levels work better for beginners than diagonal trendlines initially. Focus on obvious areas visible without zooming excessively. If you must search hard, the level likely lacks significance.
Use these basic steps to identify key levels:
- Mark recent swing highs and lows
- Focus on areas with multiple reactions
- Ignore minor single-touch levels
Identifying levels becomes easier with repetition. Simplicity improves consistency during early learning.
Support and Resistance Across Timeframes
Support and resistance exist on all timeframes. Higher timeframes carry more weight because they include more data and participation. Levels on daily charts often influence intraday price behavior.
Beginners benefit from marking levels on higher timeframes first, then refining entries on lower timeframes. This approach adds context and prevents trading against the dominant market structure. Timeframe alignment reduces false signals. When multiple timeframes agree, reactions tend to be stronger and clearer.
Role Reversal Between Support and Resistance
A broken support level often becomes resistance. A broken resistance level often becomes support. This behavior reflects changing sentiment. Buyers who failed to hold price exit positions. Sellers gain confidence at prior support.
This role reversal concept helps beginners avoid common mistakes. Instead of buying immediately after a breakdown, wait for the price to retest the level. This patience improves entry quality and reduces emotional chasing.
Understanding role reversal builds confidence in price behavior rather than prediction.
Using Support and Resistance for Trade Entries
Support and resistance help define where trades make sense, not when to click buy or sell automatically. Beginners wait for confirmation near levels rather than entering blindly. Confirmation may include rejection candles, consolidation, or momentum shifts.
Support areas favor long setups when the price shows rejection. Resistance areas favor short setups when selling pressure appears. This framework improves timing and aligns entries with market structure.
Tip: Wait for price reaction at levels, not immediate entry.
Stop Loss Placement Using Support and Resistance
Support and resistance guide logical stop placement. Stops belong beyond levels where the trade idea becomes invalid. If price breaks and holds beyond the level, the original premise fails.
Beginners often place stops too close due to fear. This results in frequent stop-outs. Using structure-based stops provides breathing room while keeping risk defined. Logical stop placement reduces emotional interference and improves trade planning consistency.
Support and Resistance in Ranging Markets
Ranging markets respect support and resistance clearly. Price oscillates between defined boundaries without strong trends. Beginners often perform better in ranges because reactions appear more predictable.
Buy near support and sell near resistance only when the range remains intact. Avoid trading the middle of the range where direction lacks clarity. Patience improves outcomes. Ranges eventually break. Be prepared to stop range trading when structure changes.
Support and Resistance in Trending Markets
In trends, support and resistance act differently. Price makes higher highs and higher lows in uptrends or lower highs and lower lows in downtrends. Support shifts upward during uptrends. Resistance shifts downward during downtrends.
Beginners should trade in the trend direction rather than against it. Look for pullbacks to support in uptrends and pullbacks to resistance in downtrends. This alignment improves probability and reduces emotional stress. Trend context matters more than isolated levels.
Common Beginner Mistakes With Support and Resistance
Beginners often draw too many levels, cluttering charts and creating confusion. Others treat levels as exact prices rather than zones. Some trade every touch without confirmation, leading to unnecessary losses. Another mistake involves ignoring higher timeframe levels. Trading against major structure increases difficulty. Awareness of these errors helps beginners correct habits early.
Warning: Overloading charts with levels reduces clarity and confidence.
Combining Support and Resistance With Risk Management
Support and resistance work best when combined with clear risk rules. Define risk before entry. Use position sizing aligned with stop distance. Avoid increasing size near levels out of excitement. Structure-based analysis loses value without protection. Risk management ensures learning continues even when levels fail, which happens regularly.
Consistency comes from combining structure with discipline.
How Beginners Practice Support and Resistance
Practice involves marking levels on historical charts and observing reactions. Replay charts if available. Focus on quality levels rather than frequency of trades. Journaling helps track whether entries respected the structure. Review mistakes objectively. Improvement comes from repetition and review, not speed. Skill develops gradually through observation and patience.
Wrapping Up
Learning support and resistance trading gives beginners a clear framework for understanding price behavior. These levels reflect collective market memory rather than prediction. When combined with patience, confirmation, and risk control, support and resistance analysis helps traders plan entries, manage exits, and approach markets with structure instead of emotion.